Why linear relationships are called linear: graph them in the xy-plane and read the slope and the y-intercept directly from y = mx + b.
Dərs
3 / 4
Bölmə
Fəsil 3
Status
Oxu izlənir
Status:Başlanmayıb
Why They’re Called Linear Relationships Now it’s time to see where linear relationships get their name. To start, you need to be familiar with the xy-plane.
The xy-plane consists of two lines called axes. The x-axis goes from left to right (horizontal). The y-axis goes from bottom to top (vertical).
Typically, the point where the two axes cross is called the origin (usually marked with an O), and it is the point where both the x-value and y-value are equal to 0. When working with graphs of mathematical functions, the x- and y-axes will comply with this arrangement, but it’s important to note that data sets represented as scatter plots, lines of best fit, and other statistical information are sometimes shown on graphs where the axes do not cross at their 0 values, and you must be alert for this situation, as it comes up often on the test.
There are often additional vertical and horizontal lines drawn on the plane that form a grid; these are evenly spaced lines that mark successive x- or y-values.
Because the y-axis goes straight up through the origin, which has an x-value of 0, all the points on the y-axis also have an x-value of 0. To the right of the y-axis are positive values of x, and to the left of the y-axis are negative values of x. The other vertical gridlines are usually (but not always!) used to denote the successive whole number values of x: 1,2,3, etc. To find the x-value of a point from a graph in that common arrangement, just count how many gridlines there are to the left or right of the y-axis.
The x-axis goes straight through the origin from left to right, and because the origin has a y-value of 0, all the points on the x-axis also have a y-value of 0. Above the x-axis are positive values of y, and below the x-axis are negative values of y. The other horizontal gridlines are usually (but not always!) used to denote the successive whole number values of y: 1,2,3, etc. To find the y-value of a point from a graph like that, count how many gridlines there are above or below the x-axis.
Points on this xy-plane will often be provided using the notation (x,y) where the first number tells us the x-value, and the second number tells us the corresponding y-value. For example, the point (4,2) is 4 lines to the right of the y-axis because the x-value is 4, and it’s 2 lines above the x-axis because the y-value is 2. Because the order in which the two elements appear is important—the first value is the x-value, and the second, the y-value—this notation represents what is called an ordered pair. The ordered pair that represents the origin is (0,0) because both the x- and y-values are 0.
Points on this xy-plane will often be provided using the notation (x,y) where the first number tells us the x-value, and the second number tells us the corresponding y-value. For example, the point (4,2) is 4 lines to the right of the y-axis because the x-value is 4, and it’s 2 lines above the x-axis because the y-value is 2. Because the order in which the two elements appear is important—the first value is the x-value, and the second, the y-value—this notation represents what is called an ordered pair. The ordered pair that represents the origin is (0,0) because both the x- and y-values are 0.
Another way you may be given the coordinates of points is based on function notation. For example, if you are told that f(4)=2, then you know that (4,2) is a point on the graph of the function because the function’s y-value is equal to 2 when the x-value is equal to 4. In other words, when plotting a function f on the xy-plane, y=f(x).
The x- and y-axes divide the xy-plane into four quadrants that are numbered with Roman numerals starting in the upper right hand corner and going counter-clockwise.
Now that we know about how points are represented on the xy-plane, let’s relate this idea to a real world situation. We will plot some data points based on a scenario and see how they form a line, and linear relationships, when graphed in the xy-plane, produce lines—that’s precisely why these relationships are "linear" (line-ar).
Molly is taking a ride on a cable car to the top of a tall building in a big city. The boarding platform is at ground level, and the building, which is located 500 feet away from the boarding dock, is 1,000 feet tall.
If Molly wanted to get to the top of the building without riding the cable car, she would have to walk horizontally 500 ft along the ground and then ride an elevator vertically 1,000 ft. The cable car, on the other hand, travels a straight line path from the dock to the top of the building that covers both the horizontal distance and vertical distance at the same time.
We can represent the cable on the xy-plane and use it to find the equation of the linear relationship between the height of the cable car and its horizontal distance from the boarding dock. If we use x to represent Molly’s horizontal distance from the dock and y to represent her height above the ground, then when Molly is first starting her ride, we can say that 0 is an x-value and 0 is the corresponding y-value (she is at the boarding dock). Therefore, if we were to graph this point, we would graph the point (0,0), which is the origin.
In order to define a specific line on a graph, we need at least two points so we can draw a line through both of them. When Molly is at the top of the building, she is 500 feet away horizontally (the x-value is 500) from the boarding dock, and she is 1,000 ft above the boarding dock (the y-value is 1000), so another point on the graph is (500,1000). When we graph this point and draw a line connecting the two points we have labelled, we can see a representation of the vertical distance from the boarding dock as a function of the horizontal distance from the boarding dock.
If the boarding dock were built closer to the base of the building, this would affect how slanted the line graph would be. The cable car would have to cover the same vertical distance in a smaller horizontal space. For example, if the boarding dock were only 250 ft away from the building, the tow line would be twice as steep.
We can write an equation to represent Molly’s height as a function of the distance from the boarding dock based on the new, steeper configuration. Her starting height is 0, but we also need to find the amount that her height changes as she moves away from the boarding dock. When we look at any two points on the line, we can find how much Molly moves upward for every foot she moves forward. Let’s use the points (0,0) and (250,1000).
We can draw two arrows that show how far away the end point at the top of the building lies from the starting point horizontally (in the x-direction) and vertically (in the y-direction). How far across we go represents the change in x-value; we can use the Greek letter delta (Δ) to mean “change in,” so we write the change in x-value as Δx, pronounced “delta x.” Similarly, how far up or down we go (that is, the movement parallel to the y-axis) represents the change in y-value; we write that change in y-value as Δy, pronounced “delta y.”
Between the two points in our picture, (0,0) and (250,1000), we can draw in two arrows (the over-and-up arrows) showing the change in the x- and y-values.
The y-value goes up by 1,000, so Δy=1000. The x-value increases by 250, so Δx=250. The word that we use to describe the steepness of such a graphed line is slope, and we define slope as the amount y changes relative to a change in x, so slope is calculated simply by dividing Δy (the change in y) by Δx (the change in x). For this line, the slope is therefore 2501000 or 4.
Slope
Slope is a quantity that shows the “steepness” of a line. It is commonly denoted by the variable m, and it is calculated using the following formula, where Δy is the change in y-values and Δx is the change in x-values.
m=ΔxΔy
Alternatively, the change in y-values can be more formally written as y2−y1, where y1 is the y-value of the first point and y2 is the y-value of the second point. The change in x-values can be written as x2−x1, where x1 is the x-value of the first point and x2 is the x-value of the second point. This equation is referred to as the Slope Formula.
and here
m=x2−x1y2−y1
While this second form of the equation is not incorrect and is sometimes useful, in general, a quicker and less error-prone method of finding the slope is by traveling from one point to the other by drawing the over-and-up arrows (as in the example above) and determining their lengths to find Δy and Δx based on the graph alone. It is very easy to mess up signs and values when substituting the coordinates of two points into the Slope Formula. However, if the points are far apart, it could be very time-consuming to do all the incremental counting required using the traveling method, and errors can creep in, so in these circumstances, the Slope Formula is the better choice.
When given points on a line, you should always start by finding the slope whenever possible. It is very rare that the slope is not important to solving a problem involving lines.
For completeness, we will demonstrate using the Slope Formula to find the same information, though we recommend drawing the over-and-up arrows on the graph to find the slope directly. The first point we will choose is (0,0), which means that x1=0 and y1=0. The second point is (250,1000), which means that x2=250 and y2=1000. Plug these values into the slope formula and be careful that you are consistent about which point is (x1,y1) and which point is (x2,y2).
m=x2−x1y2−y1
m=250−01000−0
m=2501000
m=4
The slope of a particular line will be the same no matter which two points are chosen or which point is (x1,y1) and which point is (x2,y2). What if, instead of (0,0) and (250,1000), we chose the points (250,1000) and (125,500) (this is the midpoint of the tow line because it is half of the total x distance and half of the total y-distance between the boarding dock and the top of the building)? Note also that it doesn’t matter whether we draw the over-and-up arrows above or below the line in question, as long as we make sure to go from left to right (it is not wrong to go from right to left, but you have to be careful to take negative signs into account because Δx would be negative if we go from right to left).
The y-value goes up by 500, so Δy is 500. The x-value goes up by 125, so Δx is 125. The slope is 125500, which still simplifies to 4.
Slope Intercept Form The next thing to determine when you are trying to find the equation of a line based on a graph is the points where the line crosses the axes. These crossing points are called intercepts.
Specifically, we are interested in the point where the line crosses the y-axis. For any linear graph, the point where the line crosses the y-axis is called the y-intercept.
y-intercept
The y-intercept is the point where a line crosses the y-axis. Another way of thinking about the y-intercept is that it’s the value of y when the x-value is 0 (the y-intercept is the value of f(0)). This quantity is often represented by the variable b.
In the graph below, the y-intercept is 2 because the line passes through the point (0,2), which is on the y-axis.
In real world problems, the y-intercept represents a starting or base amount when the x-value is 0. For example, if your cell phone plan charges you a fixed fee for the line each month plus an additional amount depending on how much data you use, the y-intercept of the function representing this linear relationship will be that base fee for the line; that’s what you’d pay even if you use 0 gigabytes of data in a given month. As another example, in the last chapter, we talked about George’s numerous pens, and the number of pens he started his collection with is 20, so 20 is the y-intercept.
When you need to solve for the y-intercept of the graph of an equation or function, substitute 0 for x and solve for y.
x-intercept
The x-intercept is the point where a line crosses the x-axis, and it can also be thought of as the value of x when the y-value is 0.
In the graph below, the x-intercept is -2 because the line passes through the point (−2,0), which is on the x-axis.
When you need to solve for the x-intercept of the graph of an equation or function, substitute 0 for y and solve for x.
All we have done is given new names to concepts we were already familiar with. The starting amount is the y-intercept, and the amount the values change is the slope. We can use this information to define a general linear equation that can be used even when we don’t have a real world context to work from. It’s called the Slope-Intercept Form of a line, and it’s one of the most useful representations of lines on this test.
Slope-Intercept Form
For a line with slope m and y-intercept b, the Slope-Intercept Form of linear equations is the following:
y=mx+b
Note that any of the letters in the Slope-Intercept Form can change; the letters used above are the ones most commonly used by convention, but sometimes different letters that are more meaningful in the context of a specific problem are used instead for clarity. The arrangement and meaning of the terms are what really matter.
In the case of Molly on the cable car, we can find the equation that represents the linear relationship between her height above the ground and her distance (horizontally) from the boarding dock based on just two points on the line. We used the points (0,0) and (250,1000) to find that the slope of the line is 4. Also, we know the y-intercept of the line because the cable passes through the point (0,0); since the x-value of the point is 0, this point is the y-intercept of the line. Since we know the slope is 4 and the y-intercept is 0, the equation that represents the linear relationship in this example is y=4x+0, or just y=4x.
1
Which of the following is an equation of line ℓ in the xy-plane above?
A)x=2
B)y=1
C)y=x+2
D)y=2x+1
Slopes Aren’t Always Positive Integers The slopes of lines are not always positive; they can be positive, negative, or zero. Also, a slope does not need to be an integer.
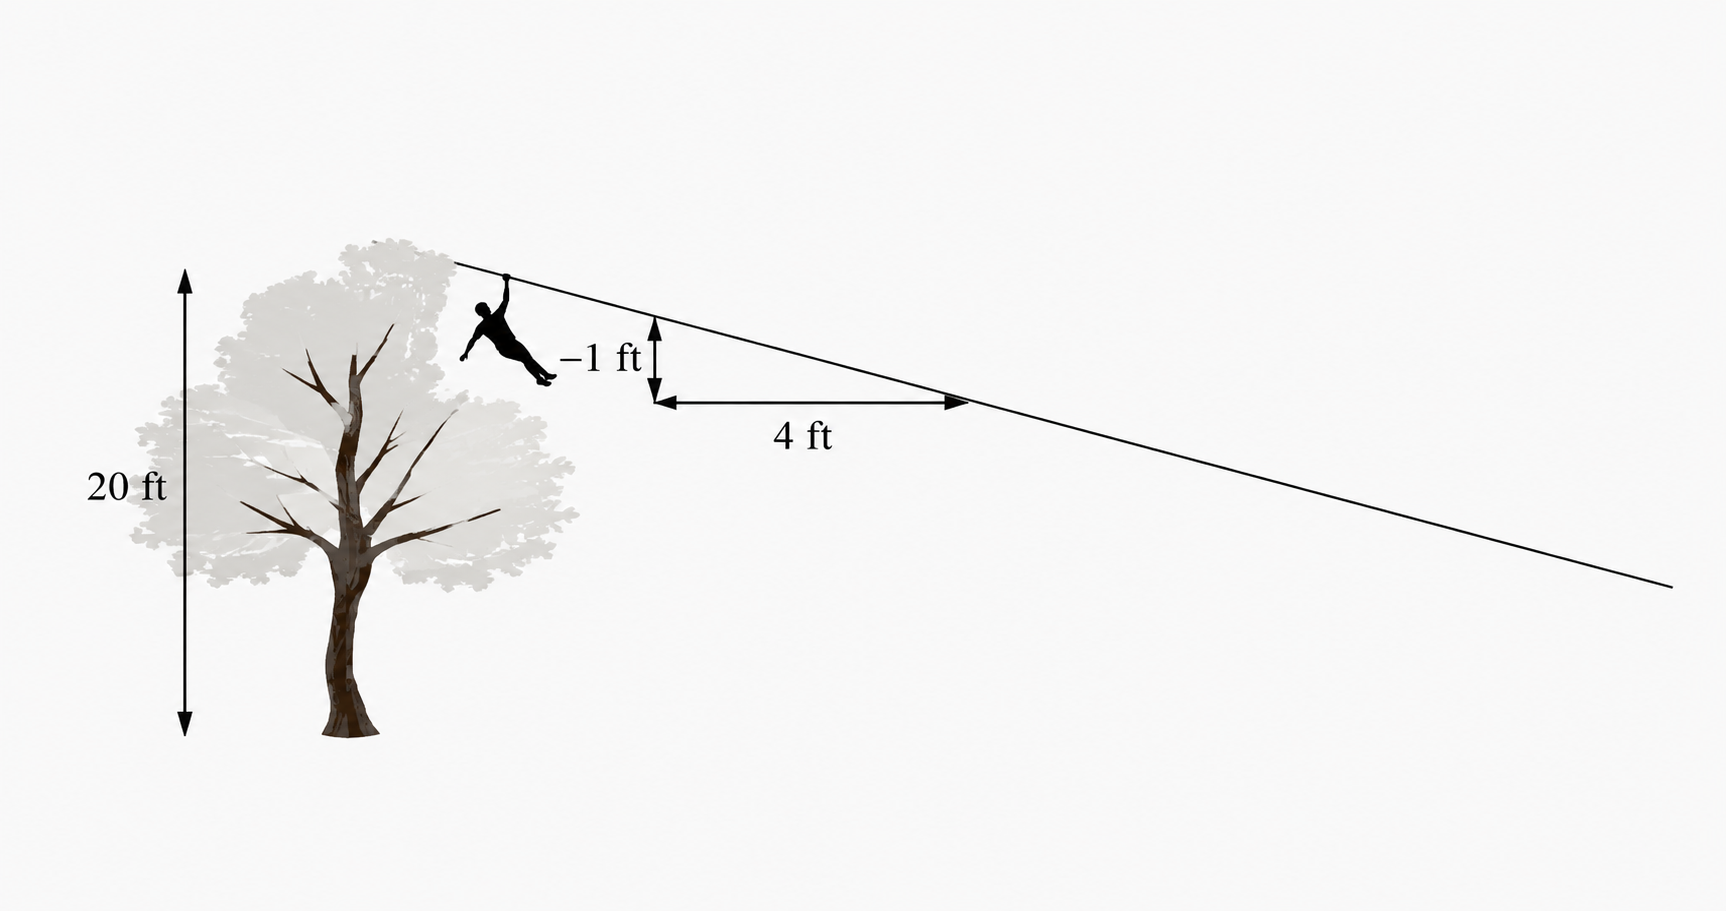
David owns an adventure course with a zipline on which the rider starts 20 ft in the air, and the zipline is sloped such that the height drops by 1 ft for every 4 ft that a rider travels horizontally.
In this example, we can say that the y-intercept is 20 because the zipliner starts at a height of 20 feet off the ground when he has moved 0 ft away from the tree. The slope is 4−1 because the rider’s height goes down by 1 ft (that is, it changes by −1 ft) for every 4 ft he moves away from the tree. The equation of the line is y=4−1x+20.
Note that a negative fractional slope might be written in the form 4−1 or −41, but the value is the same; in the example below, the second form is used, so don’t let that confuse you. Also note that when we draw the over-and-down arrows, we are still working from left to right so that Δx (the “over”) will always be positive and Δy can be positive or negative depending on how the y-values change between the two points.
2
Which of the following could be an equation for the graph shown in the xy-plane above?
A)y=−31x+6
B)y=−3x+2
C)y=−31x+2
D)y=−3x+6
As you can see, it’s possible to encounter linear relationships that do not have positive integer slopes, but finding the slope of these lines is just as easy when you are given a graph on which to find the slope. If you are given a real world situation in which the y-variable decreases as the x-variable increases, you do not necessarily need to graph the points to find the slope or equation of the line. For example, if the average temperature in a certain country drops by 1∘C every 10 days during the winter, then in a linear equation representing the average temperature in this country during winter, we can say that the slope must be 10−1 because the temperature decreases by 1 when the number of days increases by 10.
Vertical and Horizontal Lines
Vertical Lines
Vertical lines are lines where the x-value never changes. They have equations like x=5, which tells us that the x-value is always 5 and the y-value does not depend on the x-value at all.
The slope of these lines is undefined, and looking at the Slope Formula will tell us why. Since the x-value does not change, Δx=0. When we substitute 0 for Δx in the Slope Formula, we have a problem because it is impossible to divide by 0.
m=0Δy=undefined
From this, it should be clear that vertical lines have equations written in the form x=c, where c is a constant value. Note, importantly, that this equation is not in Slope-Intercept form, because that form cannot represent a vertical line. For any point on vertical lines, the x-value is fixed, but each point will have a different y-value.
We can use the Slope Formula to verify that the slope between any two of these points is undefined. From the line x=2, let’s use (2,4) as (x1,y1) and (2,2) as (x2,y2).
m=x2−x1y2−y1=2−22−4=0−2=undefined
Horizontal Lines
Horizontal lines are lines where the y-value never changes. They have equations like y=−2, which tells us that the y-value is always −2 no matter what the x-value is.
The slope of these lines is 0. Since the y-value does not change, Δy=0. When we substitute 0 for Δy in the Slope Formula, the numerator is 0, and 0 divided by a number is still 0.
m=Δx0
From this, it should be clear that horizontal lines have equations written in the form y=c, where c is a constant value. Note that, unlike the equation for a vertical line, the horizontal line equation is in Slope-Intercept form, as it is equivalent to y=0x+c.
We can use the Slope Formula to verify that the slope between any two of these points is equal to 0. From the line y=2, let’s use (4,2) as (x1,y1) and (−2,2) as (x2,y2).
m=x2−x1y2−y1=4−(−2)2−2=60=0
Ev tapşırığı
1
In the xy-plane, what is the y-intercept of the line with the equation y=3x−2?
A)3
B)31
C)−31
D)−2
Bu tapşırıq üçün həll paylaşılmayıb.
2
The line graphed in the xy-plane below models the total cost, in dollars, for a paddleboat rental, y, in a certain city park based on the number of hours the paddleboat is rented, x.
According to the graph, what is the cost for each additional hour, in dollars, of the rental?
A)0.50
B)1.00
C)1.50
D)2.00
Bu tapşırıq üçün həll paylaşılmayıb.
3
Line t is shown in the xy-plane below.
What is the slope of line t?
Bu tapşırıq üçün həll paylaşılmayıb.
4
The graph of y=f(x) is a line in the xy-plane that passes through the point (0,7) and has a slope of 3. Which of the following equations could define the function f?